So you’ve got an Insights license… now what??
Bryan Chastain, PhD
CSRA/US EPA
https://bchastain.github.io/devsummit2018/index.html


Background
-
Last year’s Dev Summit:
-
Pretty Charts: Data Viz Options for GIS Developer
-
Pre-insights
-
-
This year: Insights!
What does Insights bring to the table?
- Spatial is special
- Focus on analysis instead of simple data presentation
- Intuitive drag & drop UI

esri.com
How is it implemented?
- Built on top of ArcGIS Enterprise (& AGOL)
- Workbooks stored in Data Store
- Built on Angular with Wijmo UI controls & D3-based charts
- Workbooks are standard AGOL/Portal items that can be shared with the organization like any other item


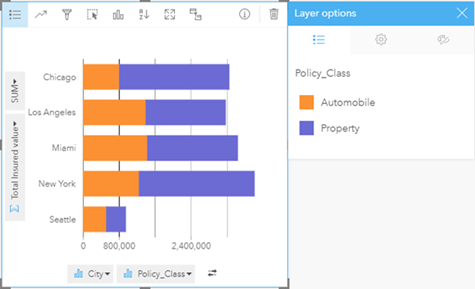
What’s new in 2.2.1?
- Cross-filters
- Calculate Z-scores
- Binned maps
- Stacked bar charts
- New data connections:
- SQL Server 2017 & SAP HANA
esri.com
esri.com
How others compare – an update
- Software
- Qlik
- Tableau
- PowerBI
- Scripting:
- D3 (& D3-based alternatives)
- R-Shiny
- Qlik Sense built-in maps
- Really only good for point data and simple KML
- Limited to 1 layer
- Qlik GeoAnalytics
- Can consume most GIS data formats
- Can consume map/feature services via JSON
- Standard geography layers included
- Additional licensing
- 3rd party extensions:
- QlikMaps
- Geo-Discover

Spatial Example: Insights & Qlik
Tableau
- Since last year, have added support for WMS and Mapbox layers
- Also Added geojson support
- Still very limited custom polygon support
- 3rd party tools to help, but not easy
Spatial Example - Insights & Tableau
PowerBI
- Since last year
- Drive-time areas
- Custom tooltips
- Living Atlas (Premium)
- Still no “Publish to Web”!
Insights Strengths
- More intuitive interface
- Simple drag-and-drop
- Very easy to quickly create custom variables
- Much easier to set up relationships between tables
Insights Strengths - Analysis
- Analysis-driven, great for data exploration
- Insights guides you through questions to find answers
- Spatial analysis tools not provided elsewhere
- Drive-times, filtering, enrichment, etc.
- Everything is recorded as models, and can share workflows
Insights Strengths - Spatial First
- Spatial first, not an afterthought or add-on
- Drag-and-drop spatial filtering and aggregation
- Access to all data in the Living Atlas
Insights Limitations - Presentation
- Insights is analyst-focused, so sometimes lacks in presentation
- Very limited customization of charts (colors, labels, etc)
- Can only share an entire page, not a single card (yet)
- In AGOL, no public sharing at all (yet)
Insights Limitations - Extensibility
- Both Tableau and Qlik Sense have APIs that provide much more customizability than Insights
- Both have APIs to develop new visualization extensions as well as REST APIs to interact with the server
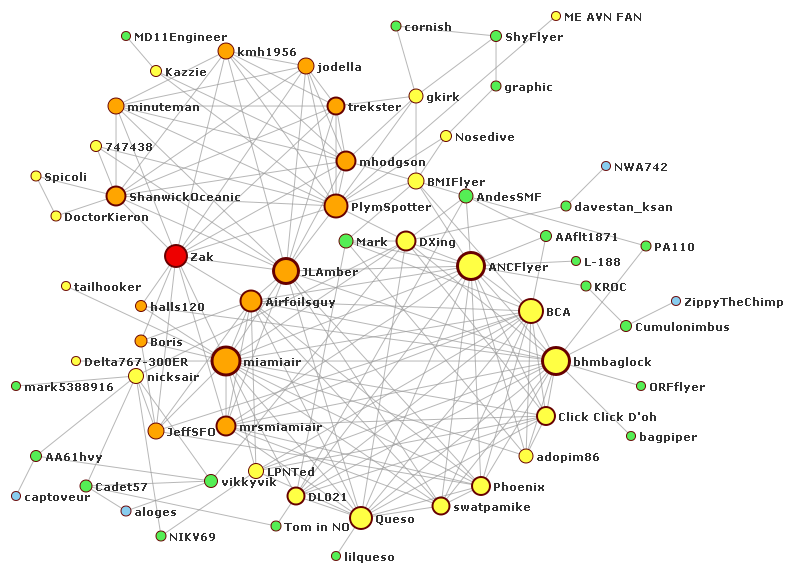
Extensibility Example - Qlik
-
Don’t like the built-in charts in Qlik?
-
Qlik has an online community called Qlik Branch where users can post their own custom extensions
-
Developers can then take those and customize even further
Limitations of Insights - Connectivity
- Insights is improving this all the time, but still not as many options as other software
- Oracle, Teradata, SQL Server, SAP HANA
- Qlik and Tableau provide many more
- Apache Hive, Cloudera, DB2, MySQL, Postgres, Salesforce, Sybase, Microsoft Sharepoint, REST JSON, Dropbox and more


Limitations of Insights - Advanced Aggregation
- Both Tableau and Qlik have the ability to compute aggregations that are not at the level of detail of the current dimension
- Tableau: Level of Detail Expressions
- Qlik: Set Expressions
- Can do some level of aggregation in Insights, but not to the same degree
Limitations of Insights - Advanced Crossfiltering
- Insights 2.2.1 has cross-filtering – yay!
- Unfortunately, there is no way to control what all gets cross-filtered
- All selections/filters passed along
- Sometimes need to obtain some static calculated value that is not affected by any filters that are applied to the view
- Tableau: Triggers OR LoD expressions
- Qlik: Set expressions
When to use Insights?
- Is your data already in Esri ecosystem?
- If not Esri-hosted, but still complex spatial geometry?
- If not spatial, are you concerned more with spatial analysis & data exploration or more with presentation and data viz?
- Complex considerations/trade-offs here
- Do you need to be able to connect to data sources not provided by Insights (MySQL, Postgres, Sharepoint, etc)?


Coming Soon to Insights...
- Link charts/maps
- Double-stacked bar charts
- OLS regression
- Public sharing for AGOL
- “Personal” edition of Insights for offline Desktop use
- Data refreshing
Upgrade Tips
- Have had problems several times when upgrading Insights and/or Portal
- Make sure your Server service account has full read/write permissions on these directories:
<Program Files>\ArcGIS\Server\framework\runtime\insights
<Program Files>\ArcGIS\Portal\apps\insights
- If still have issues, try a Repair
- If still have issues, uninstall & reinstall Insights (workbooks won’t be deleted)
- Ensure above directories get deleted after uninstall
Questions?
https://bchastain.github.io/devsummit2018/index.html